Este artículo también está disponible en español.
BNB has found its footing at the $605 support level, sparking optimism for a potential recovery. Following recent bearish pressure, the bulls appear to be regrouping, aiming to regain control and push the price higher. With key technical indicators signalling renewed buying interest, market participants are closely watching whether this support will serve as the launchpad for BNB’s next rally.
As BNB shows encouraging signs of revival, this article aims to delve into its rebound from the $605 support level and evaluate its capacity for a sustained recovery. By analyzing market trends, technical indicators, and key resistance levels, we seek to determine whether BNB is positioned for a fresh, bullish run or still faces the risk of renewed bearish pressure.
Technical Indicators Signal A Potential Rebound
On the 4-hour chart, BNB is currently exhibiting a steady upward trajectory despite trading below the 100-day Simple Moving Average (SMA). After rebounding strongly from the critical $605 support level, the asset is making strides to extend its gains, aiming toward the $635 resistance zone. A successful breach above the 100-day SMA could further validate its recovery, potentially opening the door to higher levels.
BNB uptrend holds despite trading below the 100-day SMA | Source: BNBUSDT on Tradingview.com
Also, the 4-hour Relative Strength Index (RSI) has rebounded to 42% from a low of 35%, signaling a resurgence in buying pressure and a shift toward a more bullish market sentiment. If the RSI rises and approaches 50%, it could confirm its upside movement, giving BNB the strength to push higher and test resistance levels.
Related Reading
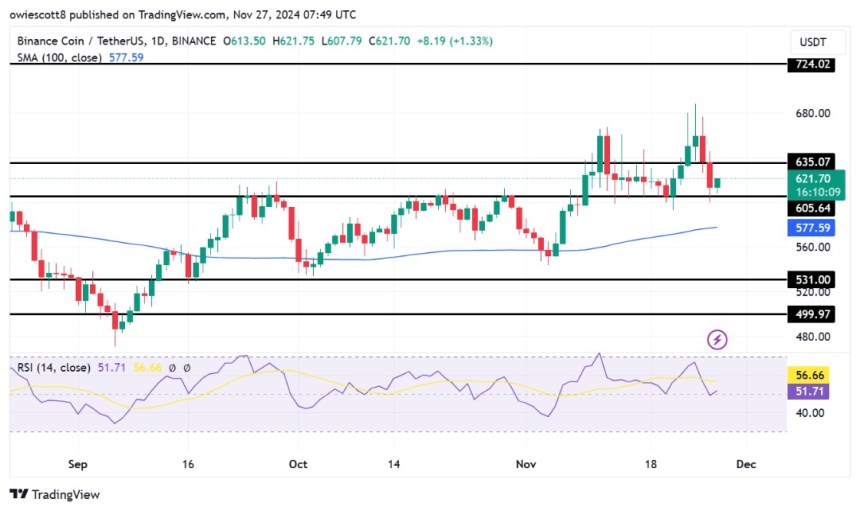
BNB is showing strong upward movement on the daily timeframe, holding above the 100-day SMA after a rebound at the $605 support level. This has provided stability, enabling the cryptocurrency to advance toward the $635 resistance level. The price movement indicates a growing optimistic sentiment as BNB trades above key technical levels.
 BNB aims for higher highs following recovery at $605 | Source: BNBUSDT on Tradingview.com
Furthermore, the daily RSI has risen above 50% after briefly dropping below it, signaling a shift to positive market sentiment. With bearish momentum subsiding, this suggests that buying pressure is stronger than selling pressure. If the RSI continues to rise, it could further support BNB’s upswing and strengthen the positive trend, possibly leading to a continued rally, targeting higher resistance levels.
Analyzing Key Resistance Targets For BNB Next Move
Following its rebound from the $605 support level, BNB is targeting the $635 resistance level, which could serve as a key obstacle. Should the cryptocurrency successfully break through this resistance, the next targets could be higher zones, such as the $724 level and beyond, signalling robust bullish momentum.
Related Reading
However, if BNB fails to break through the $635 resistance, it may indicate a potential consolidation or reversal, with the price falling toward the $605 support level. A successful break below this support could lead to more declines, targeting lower support levels.
BNB trading at $620 on the 1D chart | Source: BNBUSDT on Tradingview.com
Featured image from iStock, chart from Tradingview.com

